Personal Projects
This portfolio is a compilation of notebooks which I created for data analysis and for exploration of machine learning algorithms. It contains work from projects I have researched out of interest and curiosity, my professional career as a Data Scientist in the FinTech, Energy and Digital Media SaaS industries and from my time completing my MSc Business Analytics at Imperial College Business School.
A Deep Learning Approach to Identifying Messi: Darknet YOLOv4 Custom Object Detector
Google Colab
Object detection is a computer vision technology that deals with detecting instances of semantic objects of certain classes, such as humans, cars, weapons, etc…, in digital images and videos. The use cases of object detection models are endless as they help in tasks relating to image annotation, activity recognition, face detection, face recognition, video object co-segmentation and the tracking of objects. Advanced militaries use object detection through the combination of human visual salience and visual psychology, so as to achieve rapid and accurate detection of military objects on the vast and complex battlefield. Smart cities rely on the use of object detection to implement smart traffic management systems able to detect vacant on-street parking. This project trains a Darknet framework YOLOv4 object detection model to identify and follow Messi throughout a football game. Messi is the greatest footballer to ever play and how he plays defines his greatness, his patience and off ball movement consistently get him into scoring opportunities which he rarely wastes. When he has the ball, his low center of gravity and reactions allow him to move into space where their previously was none. His quickness and agility along with the complex task of identifying only him in a situation where there are 22 other players, 11 kitted the same, made this a great project to learn about object detection techniques.
Computer Vision Deepfakes (First Order Model Method): Face Synthesis With GANs and Autoencoders
Google Colab
The term deepfakes originated in 2017 when a Reddit user named “deepfakes” shared the first ever of this media online. These videos involved celebrities’ faces swapped onto the bodies of actresses in pornographic videos. Since then academic research and interest in deepfakes (a portmanteau of "deep learning" and "fake") has grown quickly. Deepfakes leverage powerful machine learning to manipulate a source image and generate a video using a driving media to generate visual content with a high potential to deceive. Deepfakes have garnered widespread attention for their uses in celebrity pornographic videos, fake news, hoaxes, and financial fraud. This has elicited responses from both industry and government to detect and limit their use. This project uses Aliaksandr Siarohin First Order Model Method to generate and create deepfakes of various politicians and famous sports figures. The project explains deepfakes and what they are. How they can be created and the technology behind them including generative adversarial networks, neural networks and autoencoders. The paper ends with a section about the ethics of these media and the importance of recognizing that they exist so that the public is less likely to be deceived.
WhatsApp Group Chat Analysis With Naive Bayes Message Categorization
nbviewer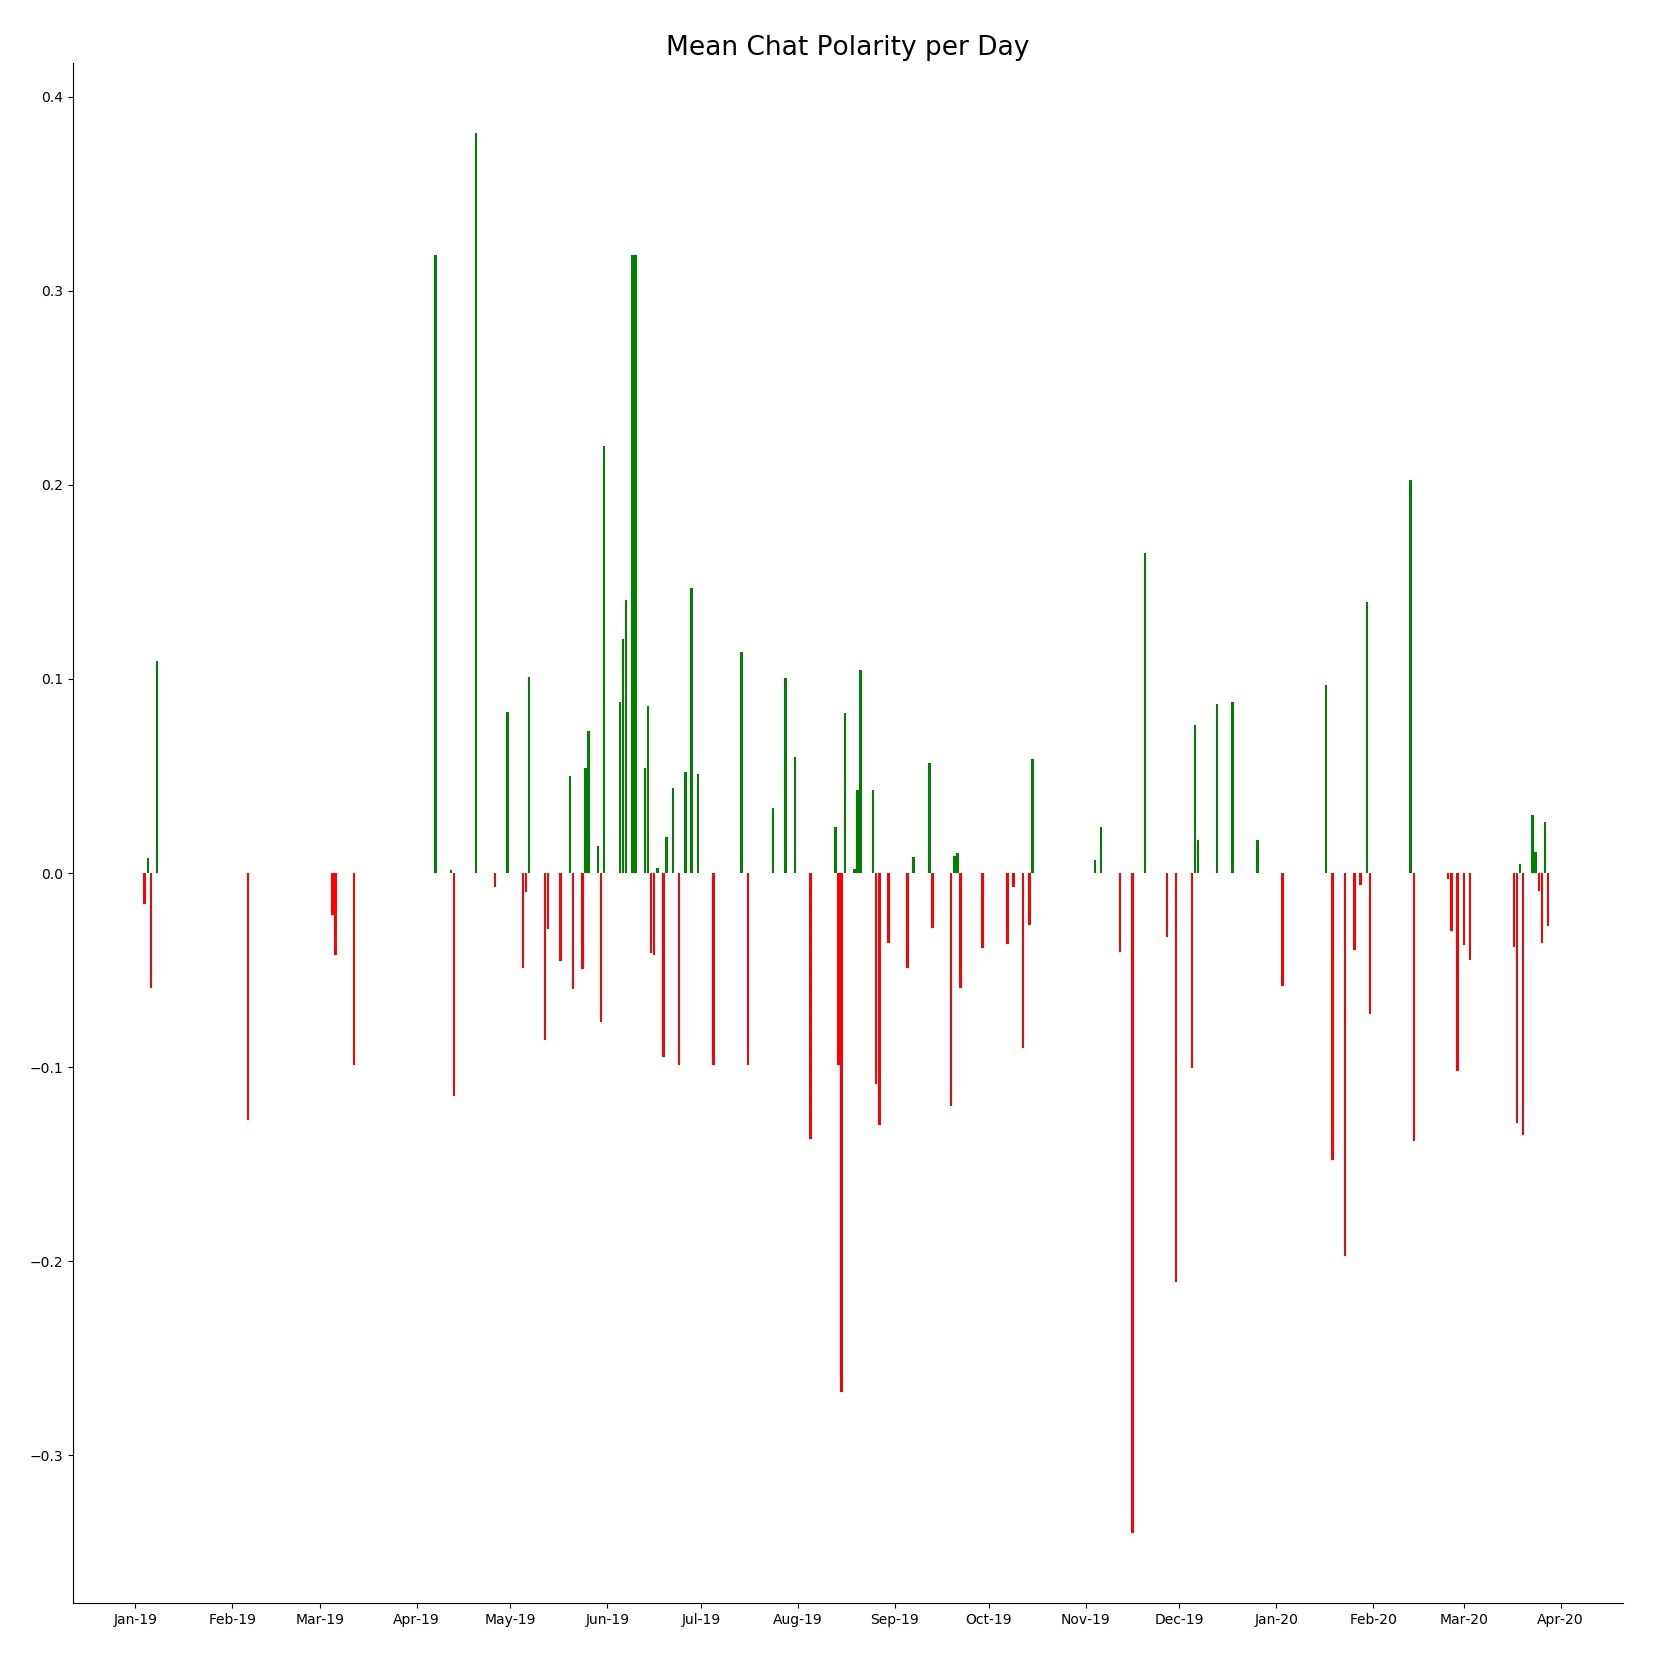
Facebook's purchase of the messaging giant for $16 billion ($4 billion cash, $12 billion in Facebook shares) back in 2014, further solidified Facebooks reach into user's everyday lives. The acquisition was one of the largest Silicon Valley had ever seen, and by far Facebook's largest purchase. So why did Facebook purchase an app that had limited revenue generation...? Growth potential and data. WhatsApp was the only app with higher engagement than Facebook itself. This project uses Python to explore the dataset and compute interesting top-level metrics. The paper aims to inform the reader about exploratory data analysis (EDA) methods and what they can show in relation to this type of data. The paper contains a detailed section on forecasting models including STL decomposition and ARIMA techniques that are utilised to forecast future message counts. The project studies an introduction into machine learning through natural language processing and the use of a Naive Bayes classifier for message segmentation. The visualizations go hand in hand with the explanations so as to provide a visual medium for the information. Applications and uses of proper EDA techniques and processes are explained. The importance of chat and text data to WhatsApp and a user interested in it is shown and the opportunities WhatsApp has available to it with everyones chat data are discussed.
Using Spotipy, K-Means Clustering and Plotly to Analyse My Personal Spotify Music Library
nbviewer
Spotify, the largest on-demand music service in the world, has a history of pushing technological boundaries and using big data, artificial intelligence and machine learning to drive success. Although it's offering is music, Spotify is a data-driven company and it uses the data in every part of the organization to drive decisions. It proudly offers over 50 million ad-free tracks to its 130 million Spotify Premium subscribers for £9.99 a month, with every stream learning more about their users. The company now has a market cap of $35 billion and from 2014 to late 2019, Spotify spent hundreds of millions of dollars acquiring data science consulting firms, music intelligence agencies, personalization and recommendation feature technology, and an artificial intelligence to strengthen their data centric offering. As the service continues to acquire data points, it’s using that information to train the algorithms and machines to listen to music and extrapolate insights that impact its business and the experience of listeners. This project uses Spotipy, Spotify’s API, to access my music library and analyze trends in listening behavior over time. It takes a detailed look into how a tracks audio features impact what I listen to and when I listen to it and provides some findings in regards to my favorite artists, albums and songs. The project utilizes PCA in order to reduce the dimensions of the audio feature list before running a K-Means model in order to classify and create custom genres from my most played tracks. It also compares my personal music taste to the Global Top 50 Spotify playlist in order to compare my likings to a viral playlist.
Winning a Tesla (Hopefully!) With Selenium Automation and Optical Character Recognition
nbviewer
Optical Character Recognition (or OCR) is the conversion of images typed, handwritten or printed text into machine-encoded text. OCR can help digitalize printed text so that it can be electronically searched for, stored and displayed. It is commonly used in machine processes such as cognitive computing, machine translation, text-to-speech and text mining and is an important field of study in pattern recognition, artificial intelligent and computer vision. Yeo Valley, a British family-owned farming and dairy company sell a fantastic brand of yogurt and their business model provides their consumers with the ability to redeem Yeokens (points) for experiences and prizes. The Yeokens are claimed by entering a dot matrix font code on the inside of their yogurt lids. An OCR engine can be linked with browser automation functions to automatize this boring stuff. This project automates the process involved in entering a promotional code on a website in order to collect points and to enter in a draw to win a Tesla Model 3. The process is split into four defined tasks; image download, image preprocessing, optical character recognition of image and promotional code submission. Selenium is used to automate the first and last stages of the process, firstly logging in to WhatsApp Web and finally simulating human-like typing upon form submission to mimic human writing behavior. Steps two and three use computer vision techniques and transformations to ensure the image input for the OCR engine is optimized. All the steps are linked together to form a script which ultimately takes an image of a yogurt lid, detects a 14 character code and enters that code into an online draw.
Natural Language Processing, Co-Occurrence and Sentiment Analysis of App Store Reviews
nbviewer
The mobile app as we know it is a little over 12 years old. There were 500 apps on the first iteration of Apple’s App Store in 2008. We’ve come a long way since then. The iOS App Store and Google Play offer users a combined 5 million apps and the number of downloads per year surpasses the 220 billion mark. Consumers averaged 3 hours and 40 minutes on mobile in 2019, up 35% since 2017—companies from every vertical are benefitting by making mobile the center of their digital transformation investments. Brands continue to embrace the unprecedented reach and value of mobile. Advertisers will pour more than $240 billion into ad spend in 2020—up 26% from 2019. This massive market that will only continue to grow as time and new technologies such as VR and AR become household obsessions also involves a massive community of customers who express their feelings for the apps they use. Venting about problems and frustration with the platform or expressing content about the ease of use. This project scrapes the Google Play and iOS App store before conducting a sentiment analysis on app reviews for 'Asos' using the VADER sentiment library. Sentiment and polarity are tracked over fiscal quarter to gain an appreciation of how users feel for the app throughout time and to appreciate rating and subjectivity changes for different app versions. A bigram model is used to investigate and plot the most probable co-occurrences for different reviews and the result is visualised using NetworkX. Finally, an analysis on Asos competitors is conducted to create to benchmark for app performance and customer sentiment in the fast-fashion industry.
Coding a Python Module to Analyze, Visualize and Track Google Trends Data
nbviewer
Launched in 2006, Google Trends, provides users with invaluable insights into how people search on the world’s most popular search engine. The vast amount of searches — trillions take place every year — make Google Trends one of the world’s largest real time datasets. Examining what people search for provides a unique perspective on what they are currently interested in and curious about. Researchers have used Google Trends data to investigate a number of questions, from exploring the course of influenza outbreaks to forecasting economic indicators. The kinds of searches that users perform can be a good proxy for the public’s interests, concerns or intentions, but these searches do not necessarily represent users’ opinions and therefore the data can be used to track industry/market traction. This project leverages the data that can be found on Google Trends through a Python library called pytrends to explore, document and visualise search interest in specific places over a set time frame. Various visualisation techniques are used to create global and country specific choropleth maps, interactive time series line graphs and animated heat maps to display search term trend patterns. Finally, through object-oriented programming, the code is packaged together to form a module that can be utilized by anyone interested in this project.
Automating the Boring Stuff: Sending Myself Data Science Interview Questions
nbviewer
Data science, making data-driven decision, is an interdisciplinary field about scientific methods, process and systems to extract knowledge from data in various forms, and take decision based on this knowledge. There are a lot of things that a data scientist should know in terms of programming, theory and communication. The interview process is long and difficult with various interviews and theoretical and practical exams. While I search for a permanent role as a Data Scientist I thought it would be best to spend time each day practicing and learning about what questions may be asked in the interviews so that I am prepared when the time comes. This project scrapes the web for data science interview questions and processes them before importing them into a PostgreSQL database. The database is used to query specific questions based on subjects (machine learning, statistics, programming) and a Python script is created which returns a random question and answer pairing and emails them to my inbox. This task if further automated using Windows Task Scheduler as the script is executed two times a day in order to get good interview practice.
Risk Management Scenario Analysis and Markowitz Efficient Frontier Portfolio Optimisation
nbviewer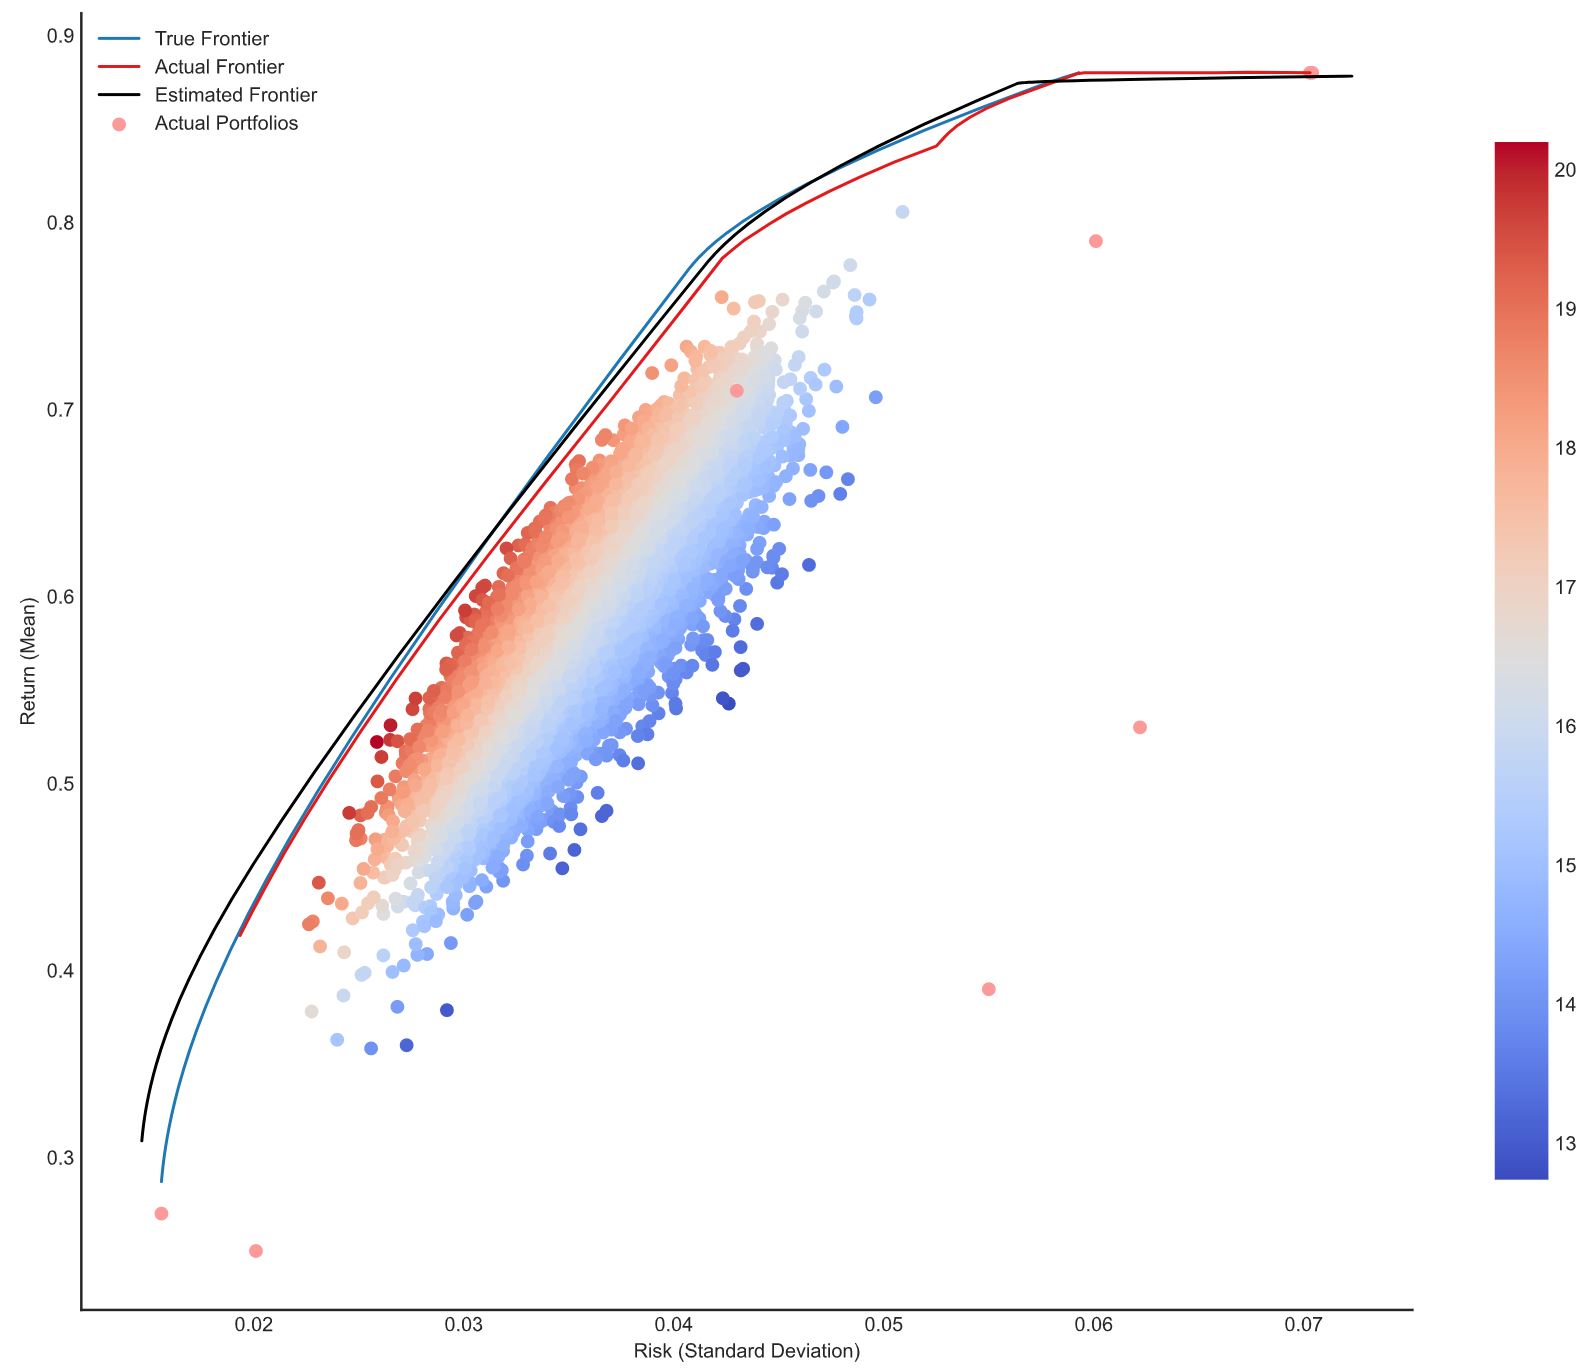
The use of scenarios in strategic decision making was pioneered by the Royal Dutch/Shell Company during the 1970s. The method is best suited to organizations and industries which are extremely sensitive to external factors beyond their control and where time frames are relatively long. In financial risk management, scenario analysis is commonly used to estimate changes to a portfolio's value in response to an unfavorable event and may be used to examine a theoretical worst-case scenario. Prior to Shell’s scenario analysis introduction, in 1952, an economist named Harry Markowitz wrote his dissertation on “Portfolio Selection”, a paper that contained theories which transformed the landscape of portfolio management. Since then the most important problem in investment has always been to construct a portfolio of assets which takes both return and risk into proper consideration. A set of holdings must be selected that are designed to conform to the investment objectives and the risk appetite. Crucially this risk appetite is not just expressed in terms of volatility or value-at-risk, but rather in terms of the portfolio’s performance in all foreseeable future states of the markets. This project runs various scenario analyses using “The Greeks” as a basis of portfolio Profit and Loss estimation. It then produces and derives the optimisation problem behind MPT, using the cvxopt package to solve for various efficient frontiers on monthly asset returns and their respective covariance matrices. Various constraints are declared on the solver to satisfy specific market conditions. Special portfolios risk-averse and risk-seeking investors might desire are identified and visualised on the frontier.
Automating the Boring Stuff: Setting My Daily NBA Fantasy Lineups
nbviewer
Fantasy basketball is a fantasy sport for basketball that was popularized during the 1990s after the advent of the Interne and has experienced an explosion in interest due to smartphones, AI and gambling legislation. Players take the role of general managers (GMs) of the fantasy teams they create from drafting actual National Basketball Association (NBA) players based primarily on their basketball statistics. There are many game modes to choose from when selecting your league. The league I play is made up of 12 owners, each drafting 15 players in a 9cat H2H format. Playing in a 9-category league essentially means that all the teams in your league are competing in 9 categories. In a head-to-head format, your team will match up against another team in your league in a given week. The league can get extremely competitive and are winners are declared on small margins. This project creates a Python script which logs into my Yahoo league and sets my daily lineup. The script is then leveraged with Task Scheduler so that it can be repeated automatically and daily, ensuring that I don’t ever forget to set my lineups. With this project I aimed to free some time up and automate a daily process in my life. Hopefully, crowning me champion!
Website Analytics - JavaScript Request Scraper
nbviewer
Tracker objects (also known as "trackers") are objects that can collect and store data and then send that data to an analytics software such as Google Analytics or Chartbeat. Upon creation, tracker objects also gather information about the current browsing context such as the page title and URL, and information about the device such as screen resolution, viewport size, and document encoding. When it's time to send data to Google Analytics, all of the information currently stored on the tracker gets sent. This information can then be analyzed and studied to identify opportunities to improve website design and CTAs in order to drive more traffic/subscriptions/revenue. This project creates a Python module that can be used to identify if a website (or list of websites) have Analytics trackers on their domains. The Python code searches for Google Analytics, Chartbeat and Facebook Pixel JavaScript requests on a website. This will help the user determine if a website has any of these codes without manually checking themselves.
Building a Facial Recognition Algorithm Using Principal Component Analysis (PCA)
nbviewer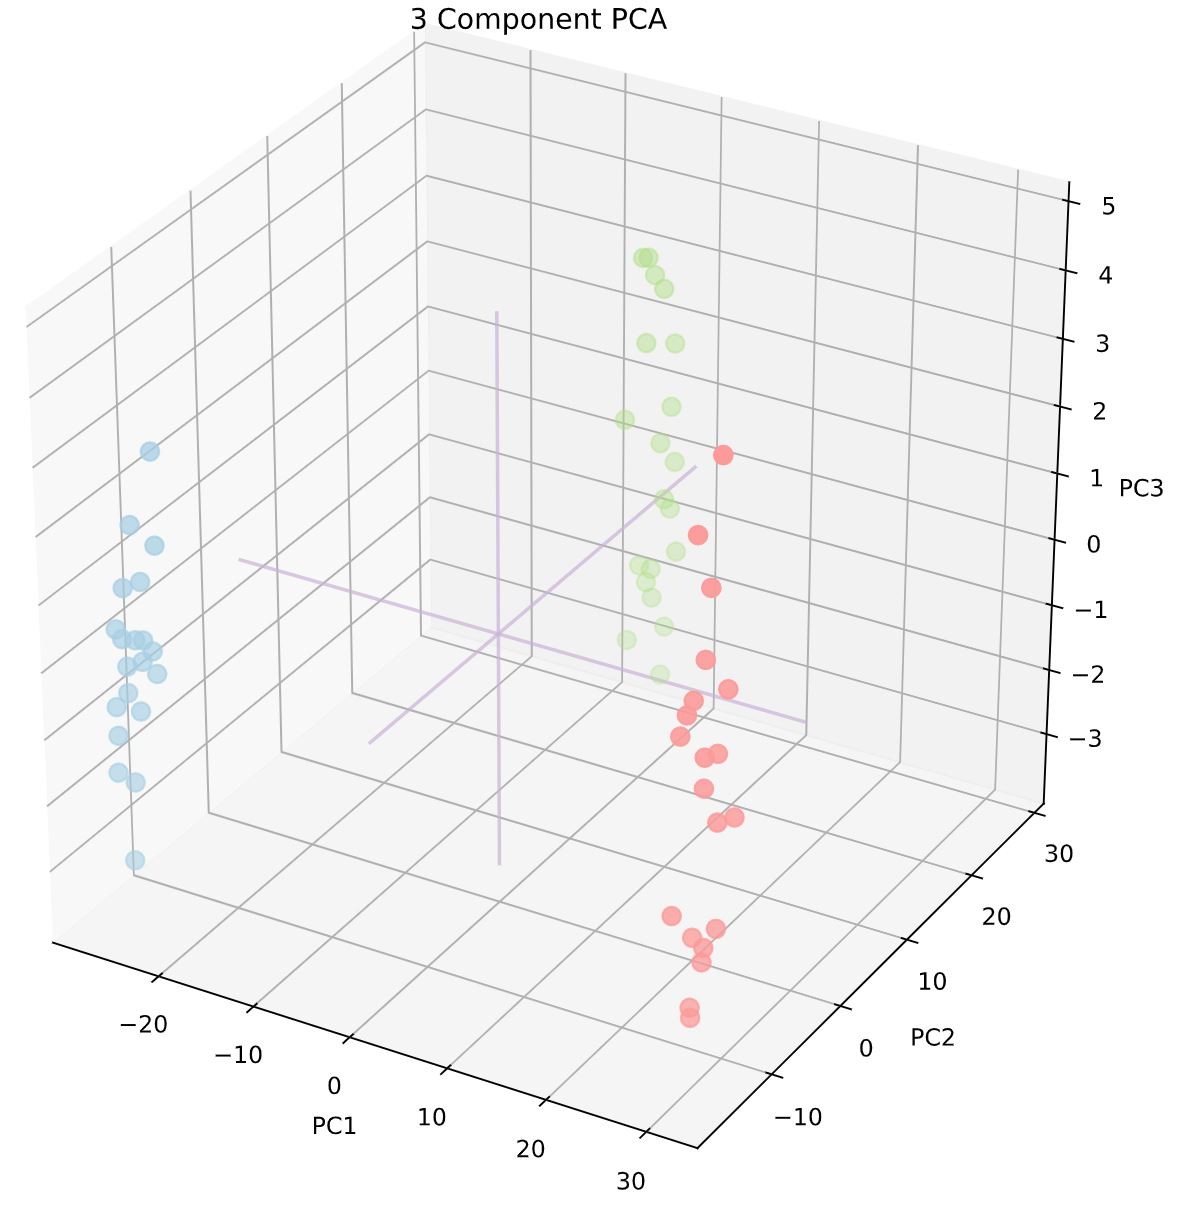
Facial recognition is utilized by SnapChat and Instagram to attract a wider user base amidst stiff competition from different applications through filters and animated lenses. Apple and Samsung have patented biometric authentication that utilize facial recognition sensors on the devices front. Facebook has a DeepFace system that employs a nine-layer neural network with over 120 million connection weights, trained on four million images uploaded by Facebook users. DeepFace shows human-level performance even outperforming us in various situations. This technology is outperforms the FBI's Next Generation Identification system. Competing with this is China which is developing facial recognition technology to identify people wearing surgical or dust masks by matching solely to eyes and foreheads. This project introduces principal component analysis to build a simple facial recognition model on two unique datasets. The unsupervised machine learning model is explained, visualized and mathematically expressed in order to build intuition. The eigenfaces are plotted from the original 4 faces along with k-dimensional reconstructions of them for k= 3, 10, 25, 50 and 200. Various machine learning models, L/QDA, Support Vector Classifier, Gaussian NB and a Multi-Layer Perceptron are built, tuned and fitted to the faces dataset for classification. Finally a synthetic dataset is created and a K-means clustering model is built. Performance of the model, the quality of the clusters, is compared to when the model is trained on raw data and to when it is trained on principal component vectors.
Django, Webhooks and Natural Language Processing for Making a Responsive WhatsApp Chatbot
nbviewer
The adoption of chatbots was accelerated in 2016 when Facebook opened up its developer platform and showed the world what is possible with chatbots through their Messenger app. Google also got in the game soon after with Google Assistant. Since then there have been a tremendous amount of chatbot apps built on websites, in applications, on social media, for customer support, and countless other examples. A chatbot are software applications that use artificial intelligence & natural language processing to understand what a human wants, and guides them to their desired outcome with as little work for the end user as possible. This project uses Python, Flask, Django and various other frameworks to code and build two different functioning chatbots. One serves as a chatbot which allows the user to have a conversation while the other is more sophisticated being that it is chatted on WhatsApp and can return famous quotes, news article and images of specific animals. The paper explains what chatbots are and how this technology may be used by a business to become more efficient and collect more data.
Automating the Boring Stuff: Creating Spotify Playlits of Soulections Radio Shows
nbviewer
Since 2011, Soulection has been a cornerstone of creativity for innovative musicians, crate-digging DJs, and open-minded fans from across the world. What began as an independent radio show has since blossomed into a global community of artists and audiences, united in a borderless, genre-bending, musical movement. Over the past nine years, their grassroots expansion is a model of what happens when one stays true to their roots in the constantly evolving digital age of music. A very good friend of mine showed me a Soulection Show in the summer of 2016 and since then I’ve listened to every single show and experienced concerts. Soulection Shows are played out on Beats1 and then archived on SoundCloud. This project has been created to extract songs from each Soulection Show and create a playlist on Spotify so that I can download and listen to each song using my music streaming service. BeautifulSoup is used to scrape each Soulection Show for Spotify songs and Spotipy, a lightweight Python library for the Spotify Web API, is used to create and edit the playlists. Finally, the code is packaged together to form a module that can be utilized by anyone interested in this project.
Using Logistic Regression to Predict Hospital Patient Readmittance
nbviewer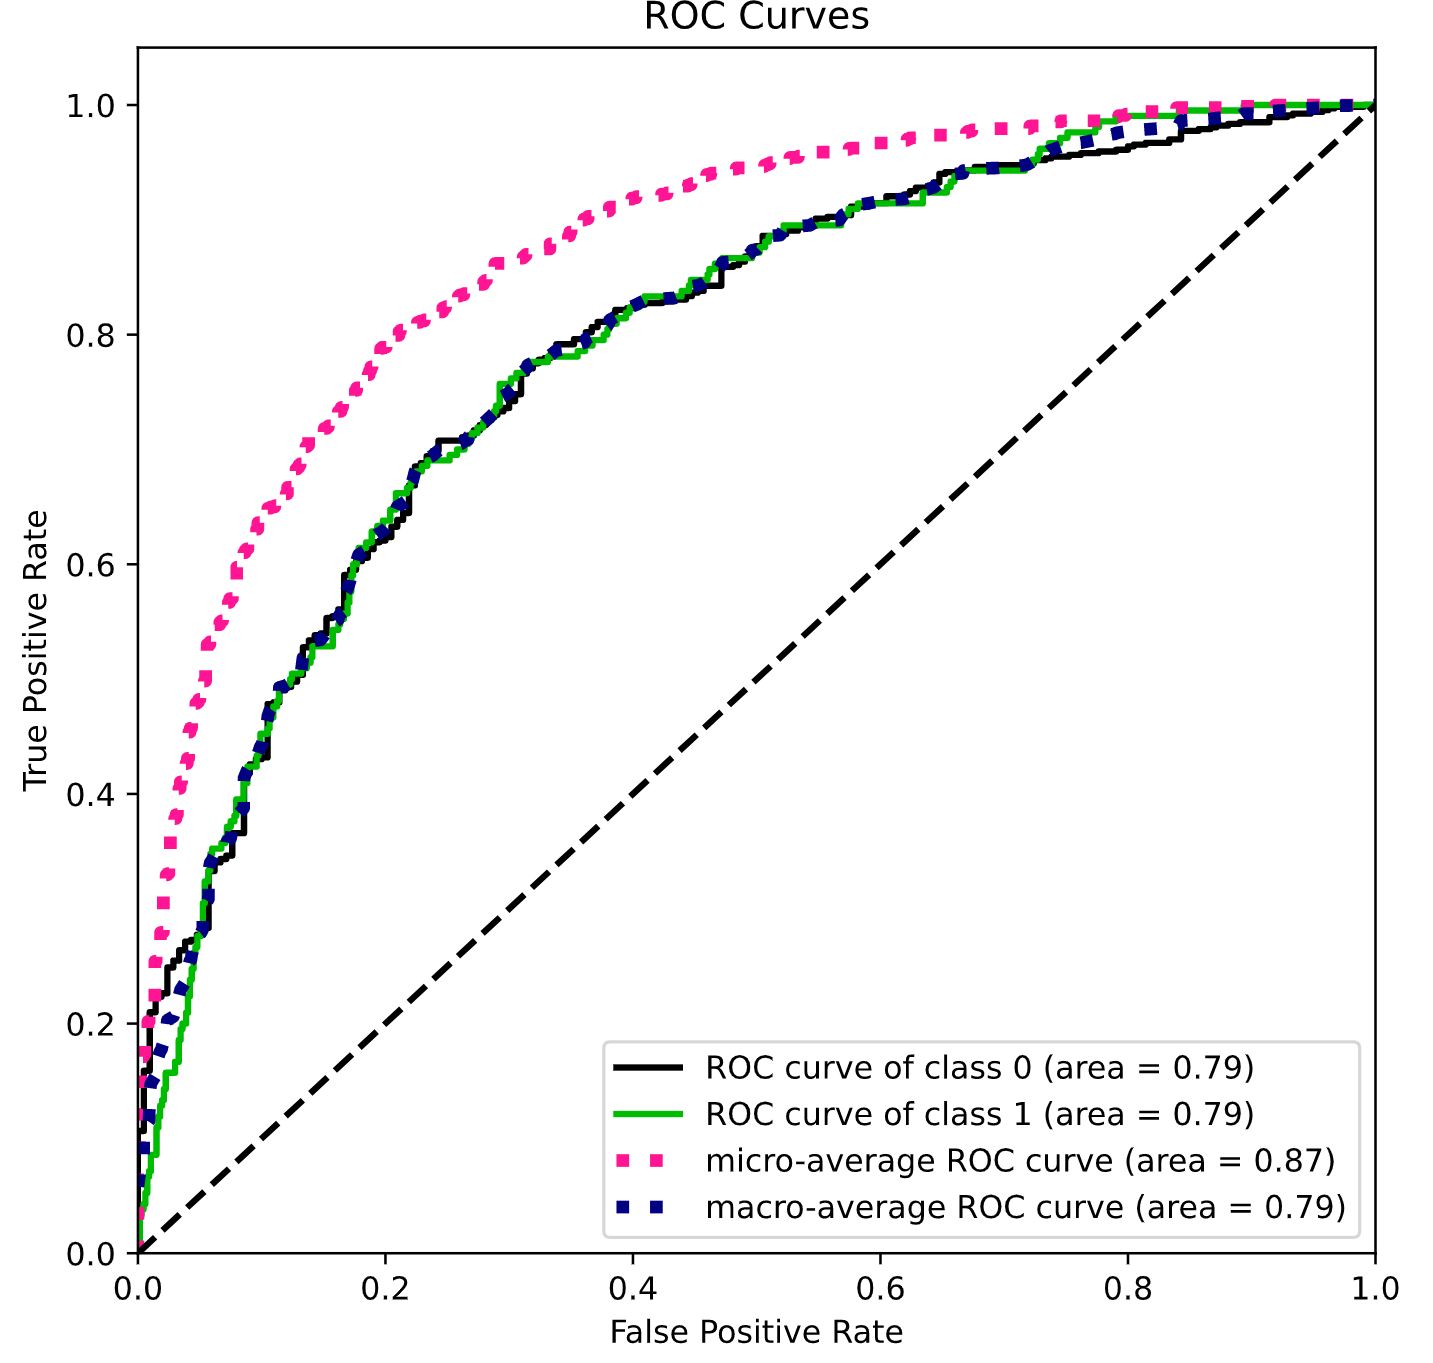
The high readmission level of hospital patients after they are discharged from the hospital is a significant concern for the US health care system. It is estimated that 20% of all hospitalized Medicare patients are readmitted within 30 days of hospitalization and 34% are readmitted within 90 days. The estimated cost of hospital readmissions is about $17.4 billion annually. To address the problem, the 2010 Affordable Care Act established a hospital readmissions reduction program (HRRP). The program created financial incentives for hospitals to reduce readmissions by linking Medicare reimbursements to a hospital’s risk-adjusted readmission rate. For 2012, penalties could be as much 1% of the total reimbursements a hospital received for the three target conditions. In the first year of the program, 2,225 hospitals were subject to reduced payment penalties, with penalties totaling $225 million nationwide. The maximum penalties were set to increase to 3% of reimbursements by 2014. This project studies the hospitals readmission rate and the costs associated with the Medicare penalties. The paper also considers a CareTracker program that aims to help paitents post care and reduce readmission rates in order to reduce Medicare penalties. A logistic regression model is applied to determine the best possible threshold, based on patient readmittence probabiloty, to apply when deciding to offer the CareTracker program or not.
Geometric Brownian Motion and Black-Scholes Delta Hedging
nbviewer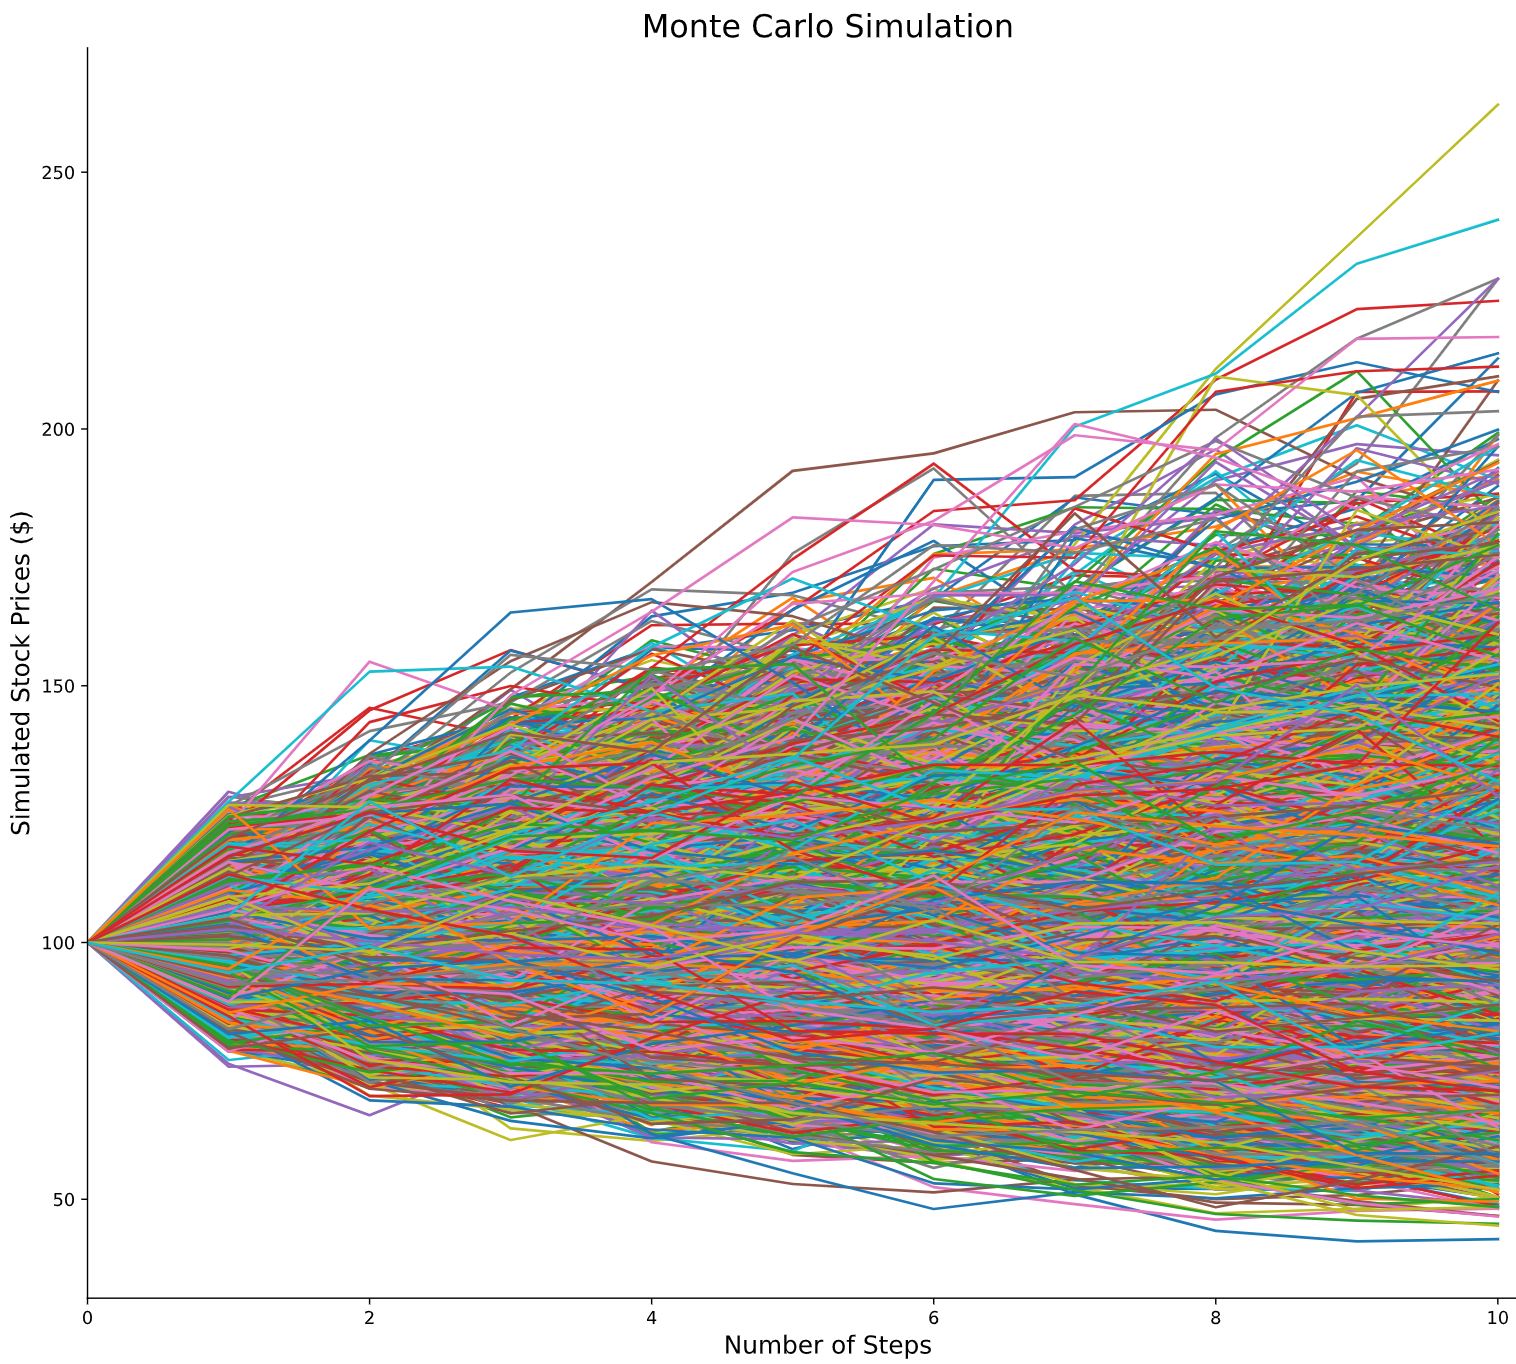
Summary statistics released in early January of 2020 by FIA show that trading activity in the global exchange-traded derivatives markets rose by 13.7% in 2019 to reach a record of 34.47 billion contracts. The options volume alone rose 16% to 15.23 billion contracts. Price movements in the options market are a reflection of decisions to buy or sell options made by millions of traders. Successful traders study the options daily trading volume and open interest when on the exchange. This project introduces the options derivative and provides terminology and the mathematical notation behind essential option pricing models. A function is built to calibrate the binomial model so that its dynamics match that of GBM allowing for convergence of binomial model option prices to Black-Scholes prices. A Monte Carlo simulation of 10,000 paths is built to estimate the price of an Asian call option. The project assumes certain market conditions so that it becomes possible to dynamically replicate the payoff of a call option using a self-financing trading strategy. The strategy requires continuous and dynamic delta hedging in the Black-Sholes model which is investigated in order to create profit and loss computations based on option volatility.
Applying Network Analytics to Visualize ETF Asset Price Correlations
nbviewer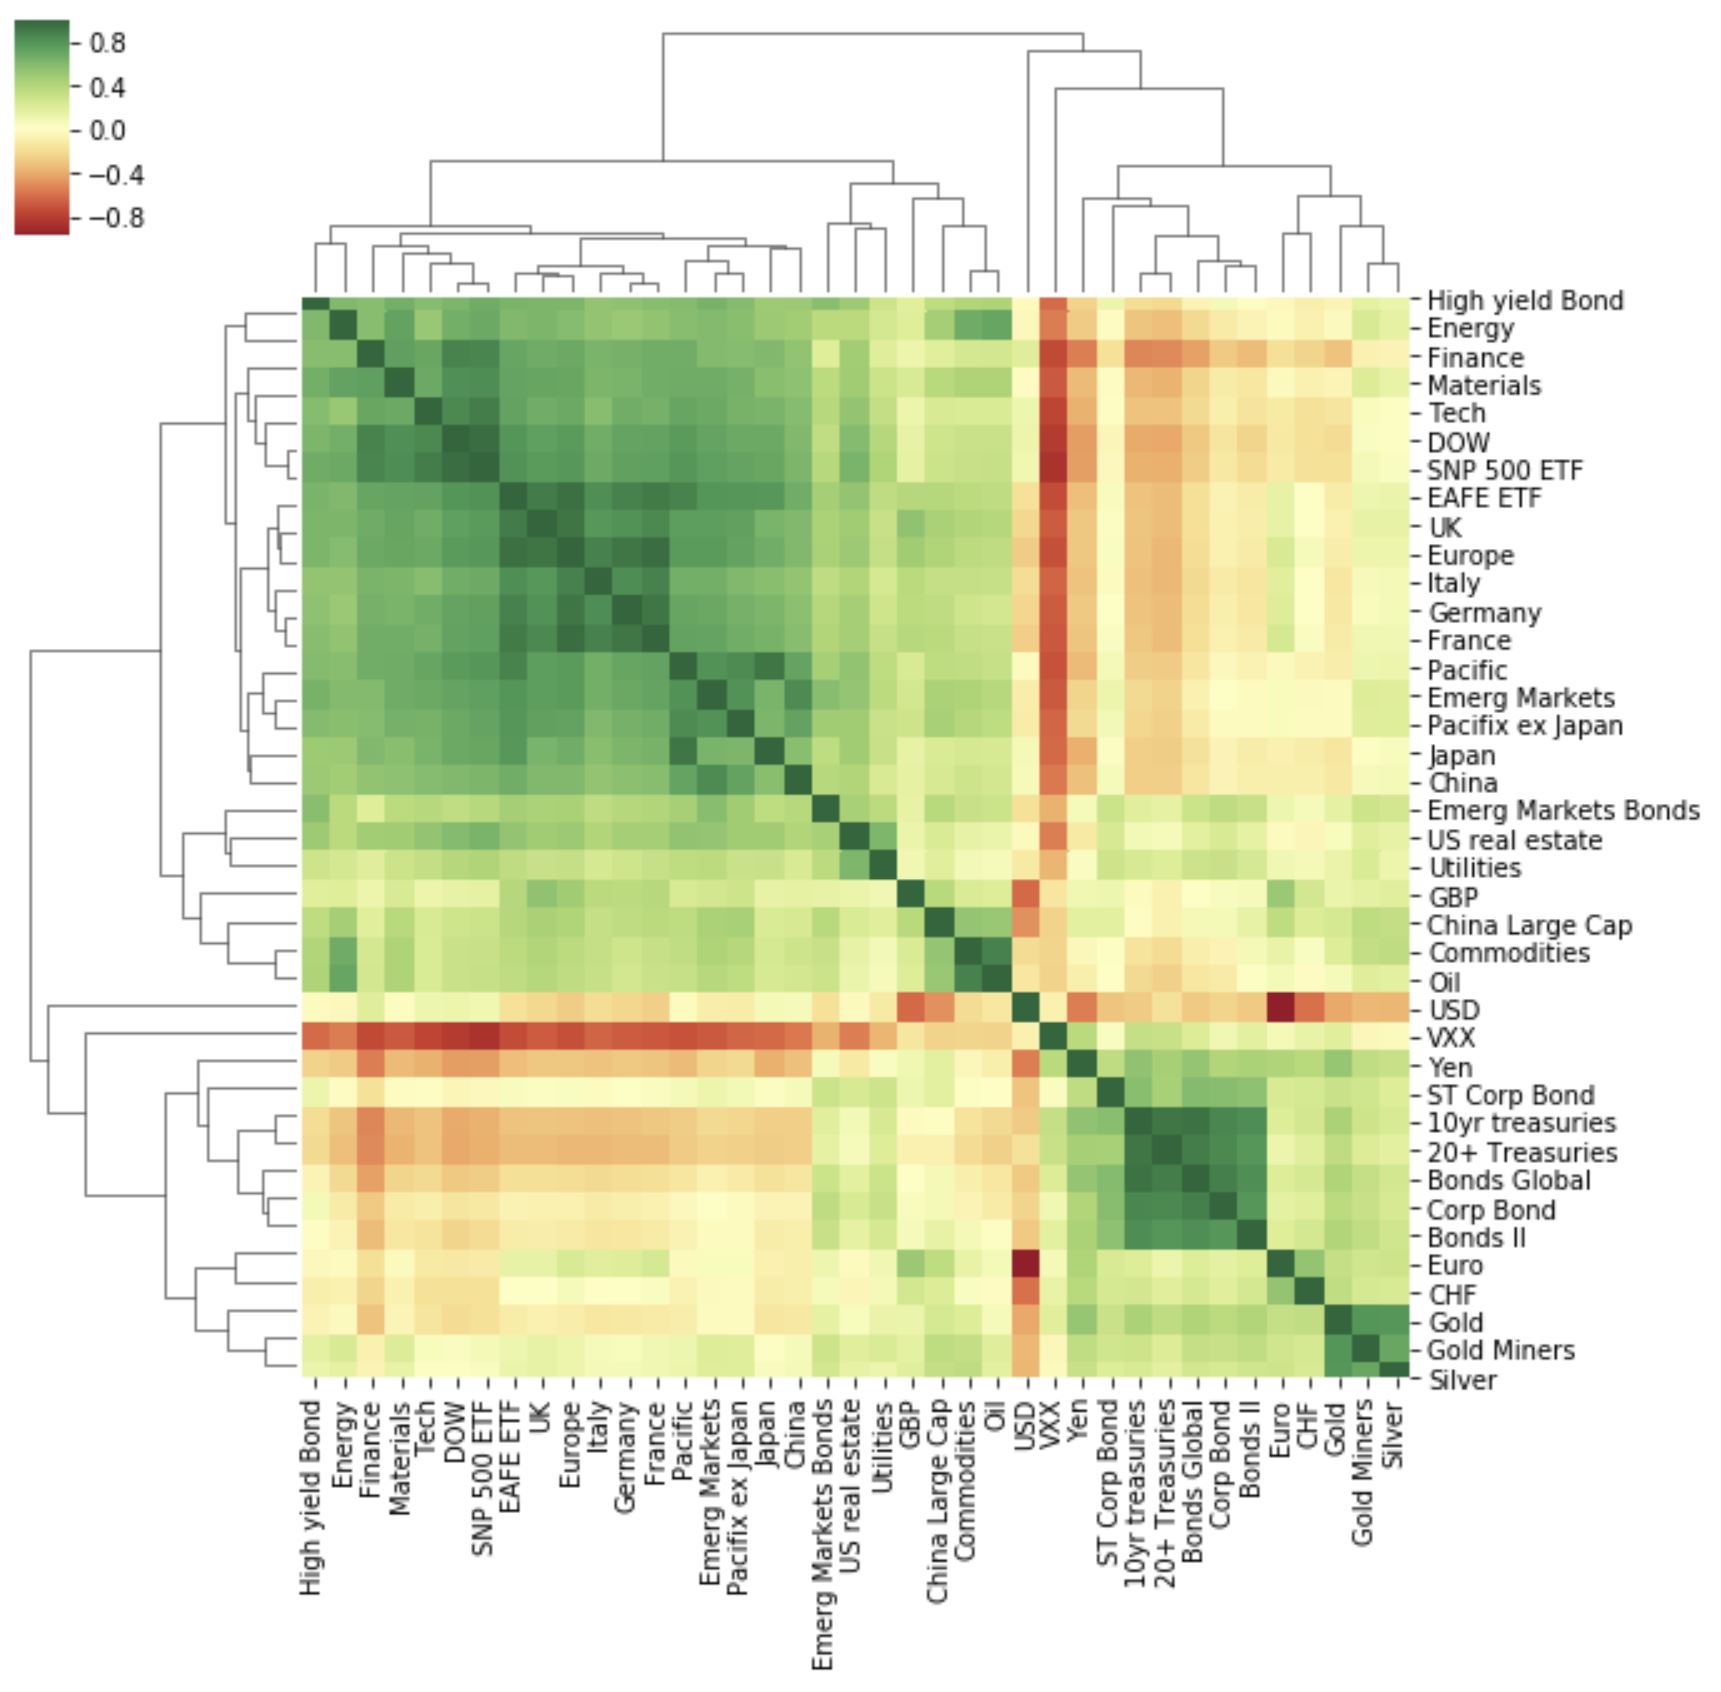
“Diversify your portfolio!” Words everyone has heard and a portfolio managers priority. Diversifying methods vary from selecting different asset classes (funds, bonds, stocks, etc.), combining industries, or varying the risk levels of investments. And the most common and direct diversification measurement used in these methods is correlation. Correlation is how closely variables are related and it may be measured with Pearsons correlation coefficient, the degree of linear relationship between two variables. Its values range between -1 (perfect negative correlation) and 1 (perfect positive correlation). While a zero correlation implies no relationship between variables. True diversification is therefore only realistically achieved by investing in assets which are uncorrelated (0) with each other. This project uses NetworkX and nxviz to investigate and visualize these relationships and investigate price correlations for 39 different assets (currencies, commodities, equities and bonds) with the aim of showing an investor what assets they might need to hold to truly diversify their portfolio.
Retail Customer Segmentation Through RFM and Customer Lifetime Value Analysis
nbviewer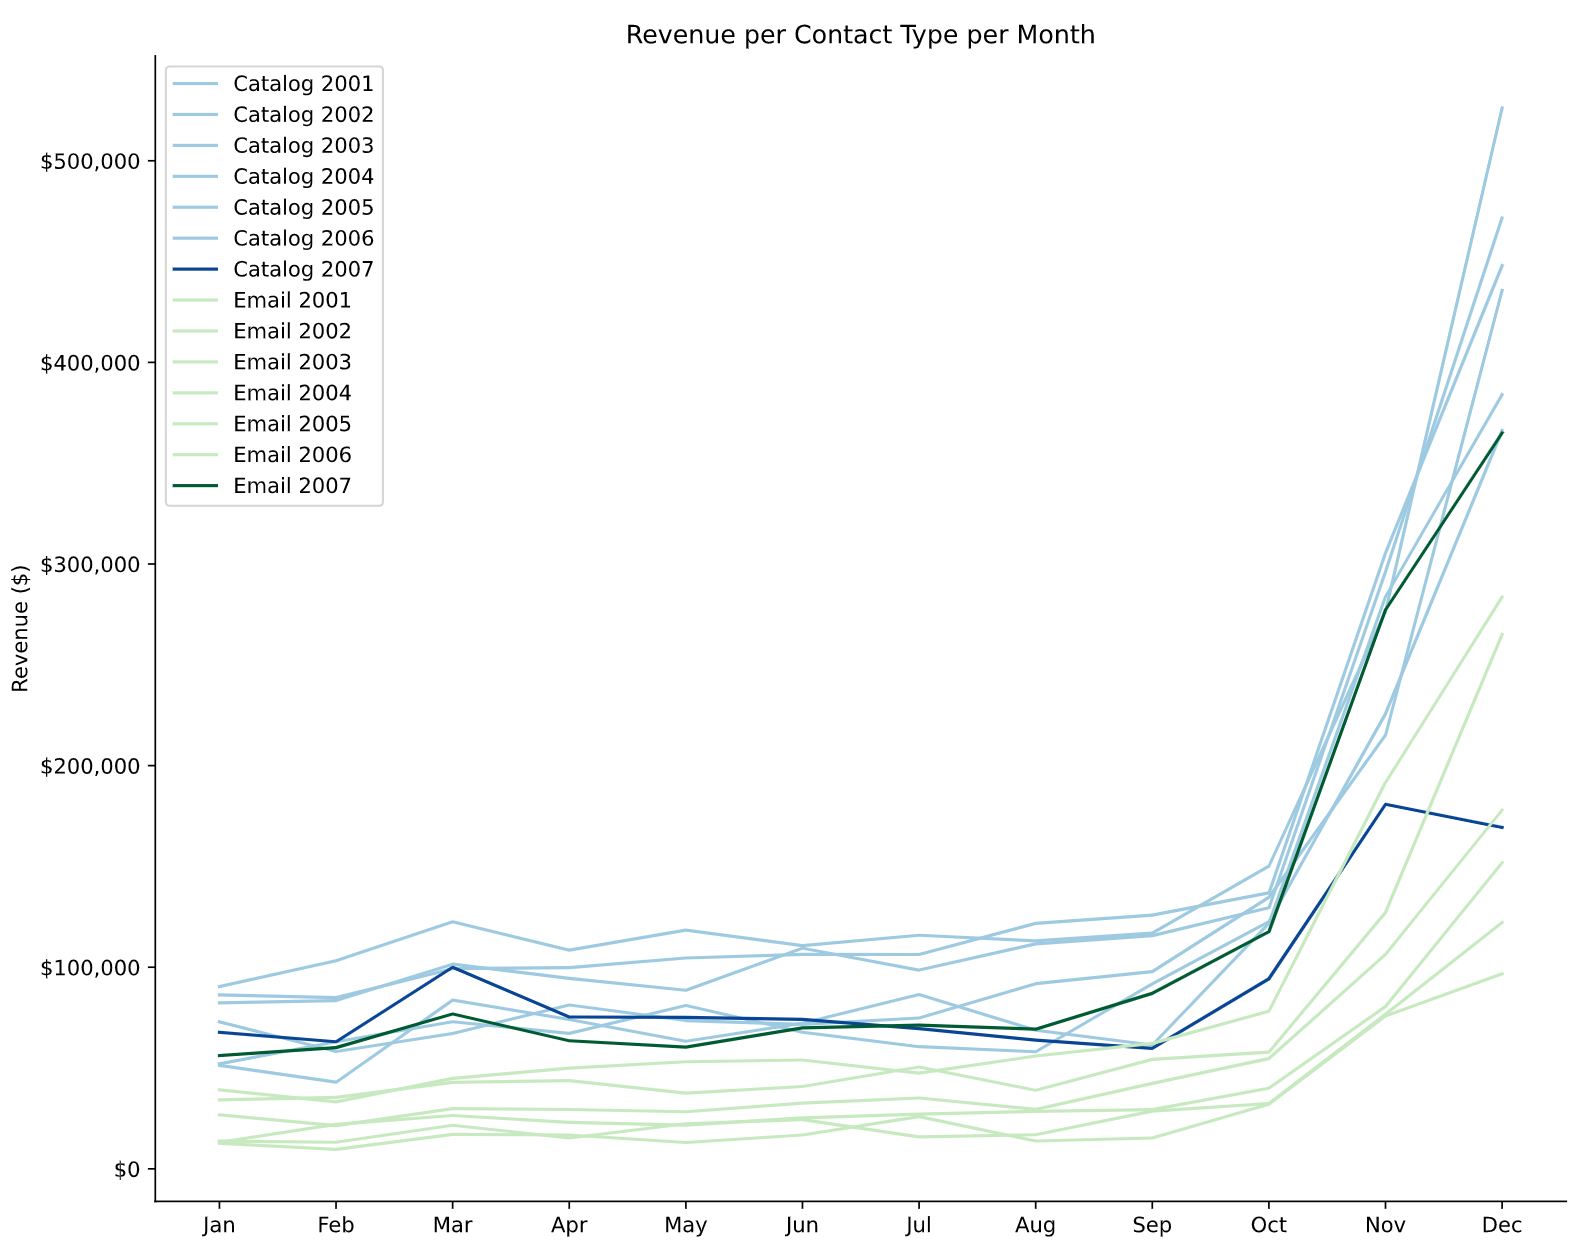
The dataset that is studied to discover customer insights and how different marketing channels impacts their purchase behavior has been provided by a multichannel company with sales of several hundred million dollars per year. The company has a network of retail stores, a well-established traditional catalog channel and a website. Its brand is very well known nationally (US) and it has a strong positive reputation along with very good long term customer loyalty. The core of the company’s business consists of food products which are often purchased as gifts during the Christmas season. This project explores this dataset and visualizes key components such as VIP customer spending, marketing channel conversion rate and order method splits before producing a more detailed section on RFM segmentation and the process involving the calculation for customer lifetime value. The data is initially pushed to a local PostgreSQL database and queired using the SQLAlchemy ORM library and Psycopg2 in order to prepare various tables needed for the investifation. RFM segmentation is a great method to identify groups of customers for special treatment because it allows marketers to target specific clusters of customers with communications that are much more relevant for their particular behavior – and thus generate much higher rates of response, plus increased loyalty and customer lifetime value.
Visualizing the Customer Funnel and Using Markov Chains for Website Page Attribution
nbviewer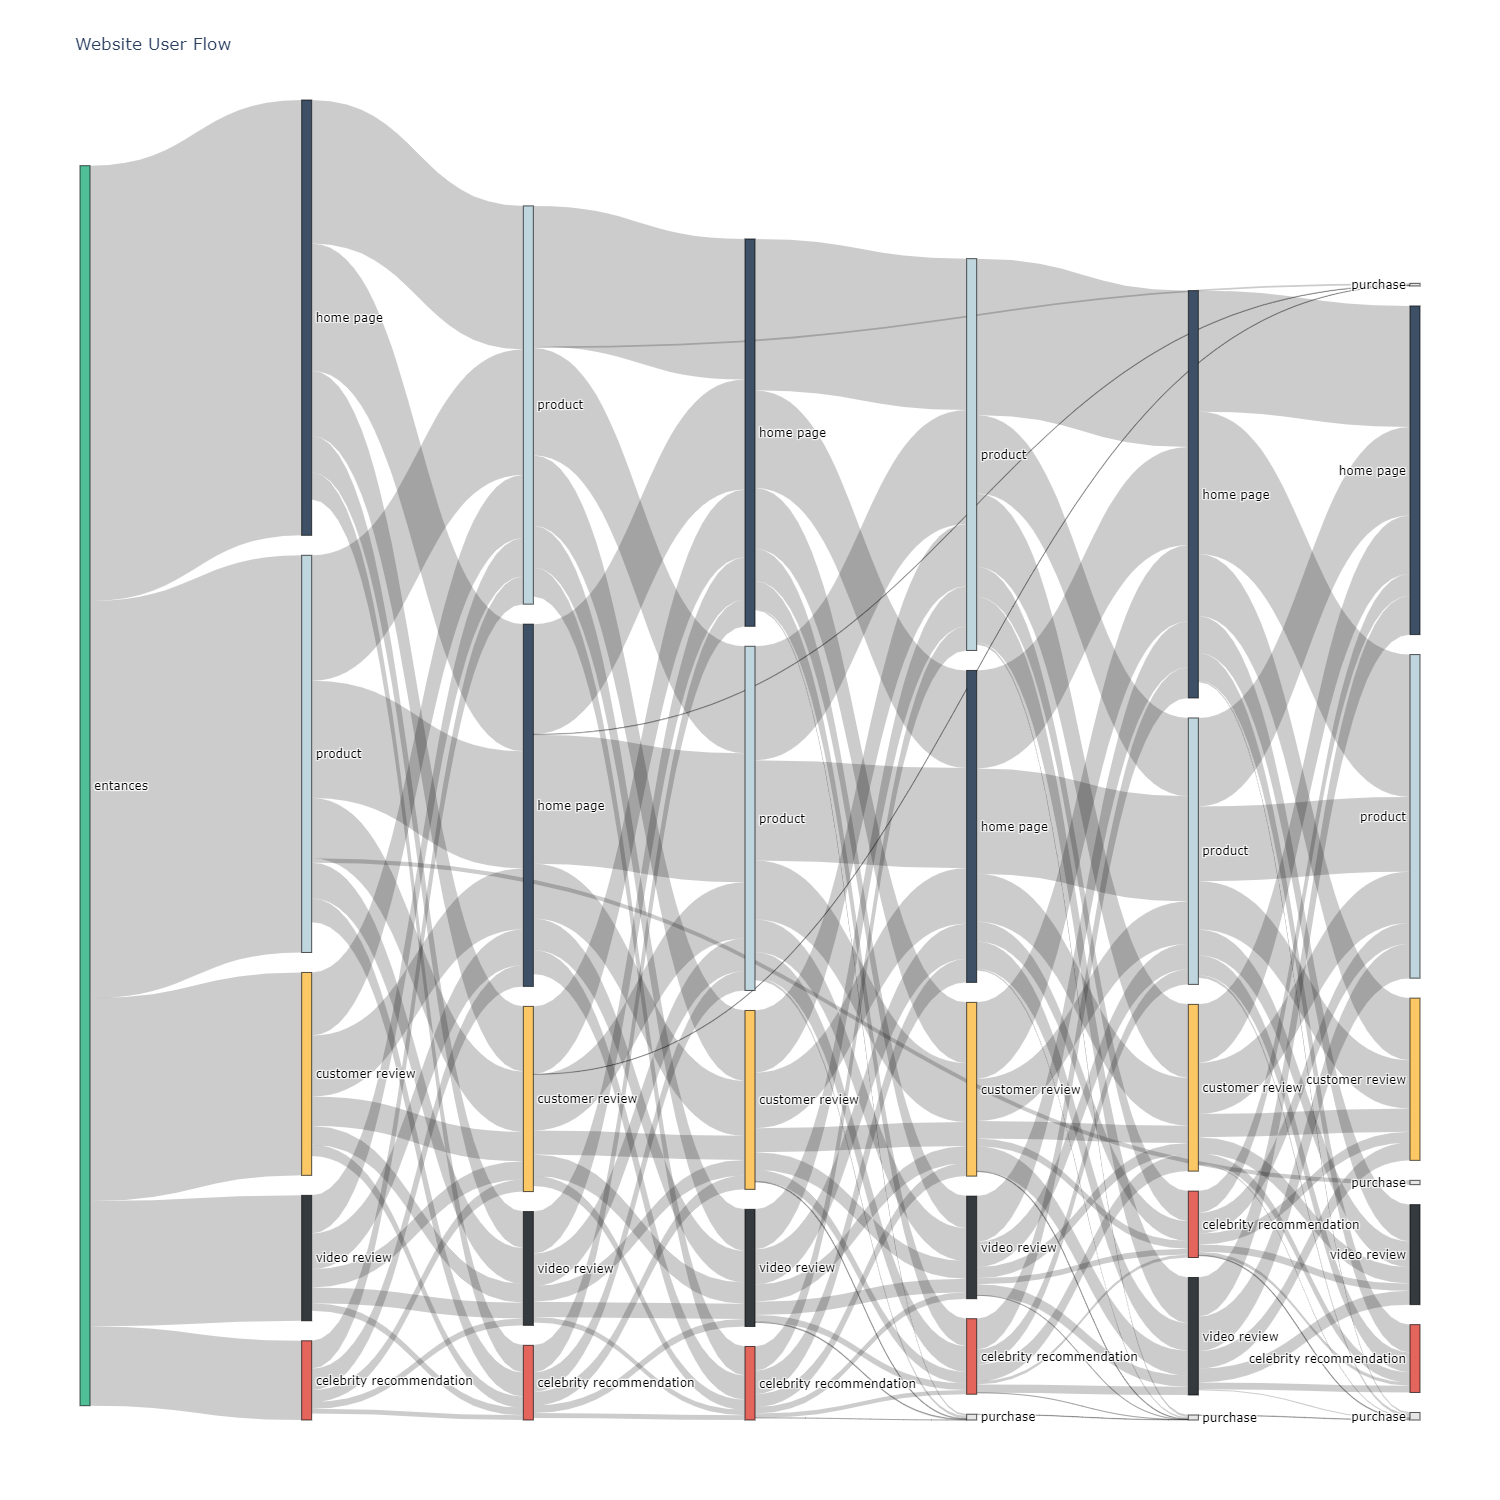
Websites collect a vast array of data for many different uses. This includes data you provide via forms, for example, email address and credit card information, as well as many other types of information gained from tracking technology in the form of cookies. Decision makers need to form data-driven approaches to enhance their website framework in order to facilitate user journey and purchasing funnel from entrance to conversion. By investigating click data and website behavior metrics the site may be optimized and user experience and therefore company revenue increased. This project investigates anonymized data from an ecommerce site. It analyzes the data to understand how customers behave and purchase on the site and provides recommendations to management for website restructure. This project uses Markov chains and transition matrices to identify the probabilities of moving from one event (page) to another. It visualizes the user flow through various interactive sankey models that rank and provide information for each step in the conversion funnel. The layout of the website and its pages are presented through a network analytics study in which various graphing algorithms are used to depict the traffic between the directed network.
Data Clustering and Community Detection in Graphs Using NetworkX
nbviewer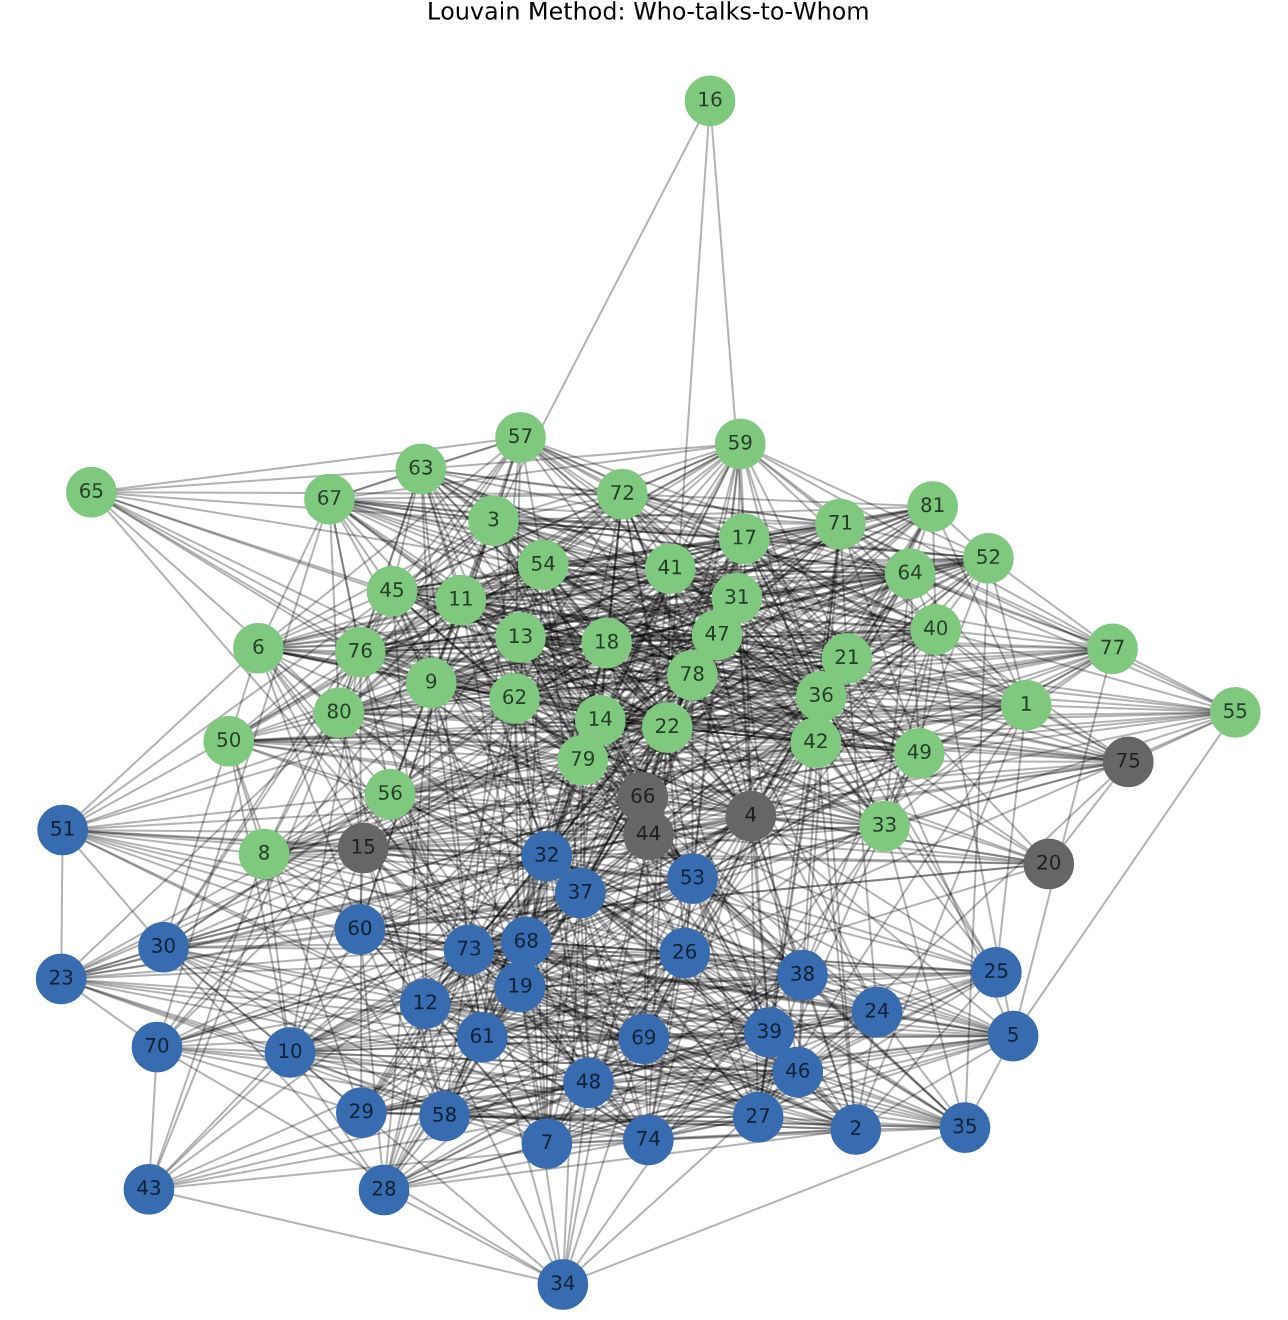
Networks are graphs which are made out of nodes and edges and they are present everywhere. Social networks composed of users owned by the likes of Facebook and Twitter contain sensitive relationship data, biological networks help analyse patterns in biological systems, such as food-webs and predator-prey interactions and narrative networks help identify key actors and the key communities or parties they are involved with. The study of a network is essential in order to learn about its information spread, players of influence and its robustness. Networks inherently contain communities, areas of densely connected nodes which provide information about the network, among that information, it allows for the creation of large scale maps of a network since individual communities act like meta-nodes in the network. NetworkX is a Python package for the creation, manipulation, and study of the structure, dynamics, and functions of complex networks. This project utilises NetwokX to investigate two different networks, studying key centrality measures and utilising the Girvan–Newman and the Louvain Modularity methods to explore network communities.
Exploring & Machine Learning With Airbnb Listings in New Orleans
nbviewer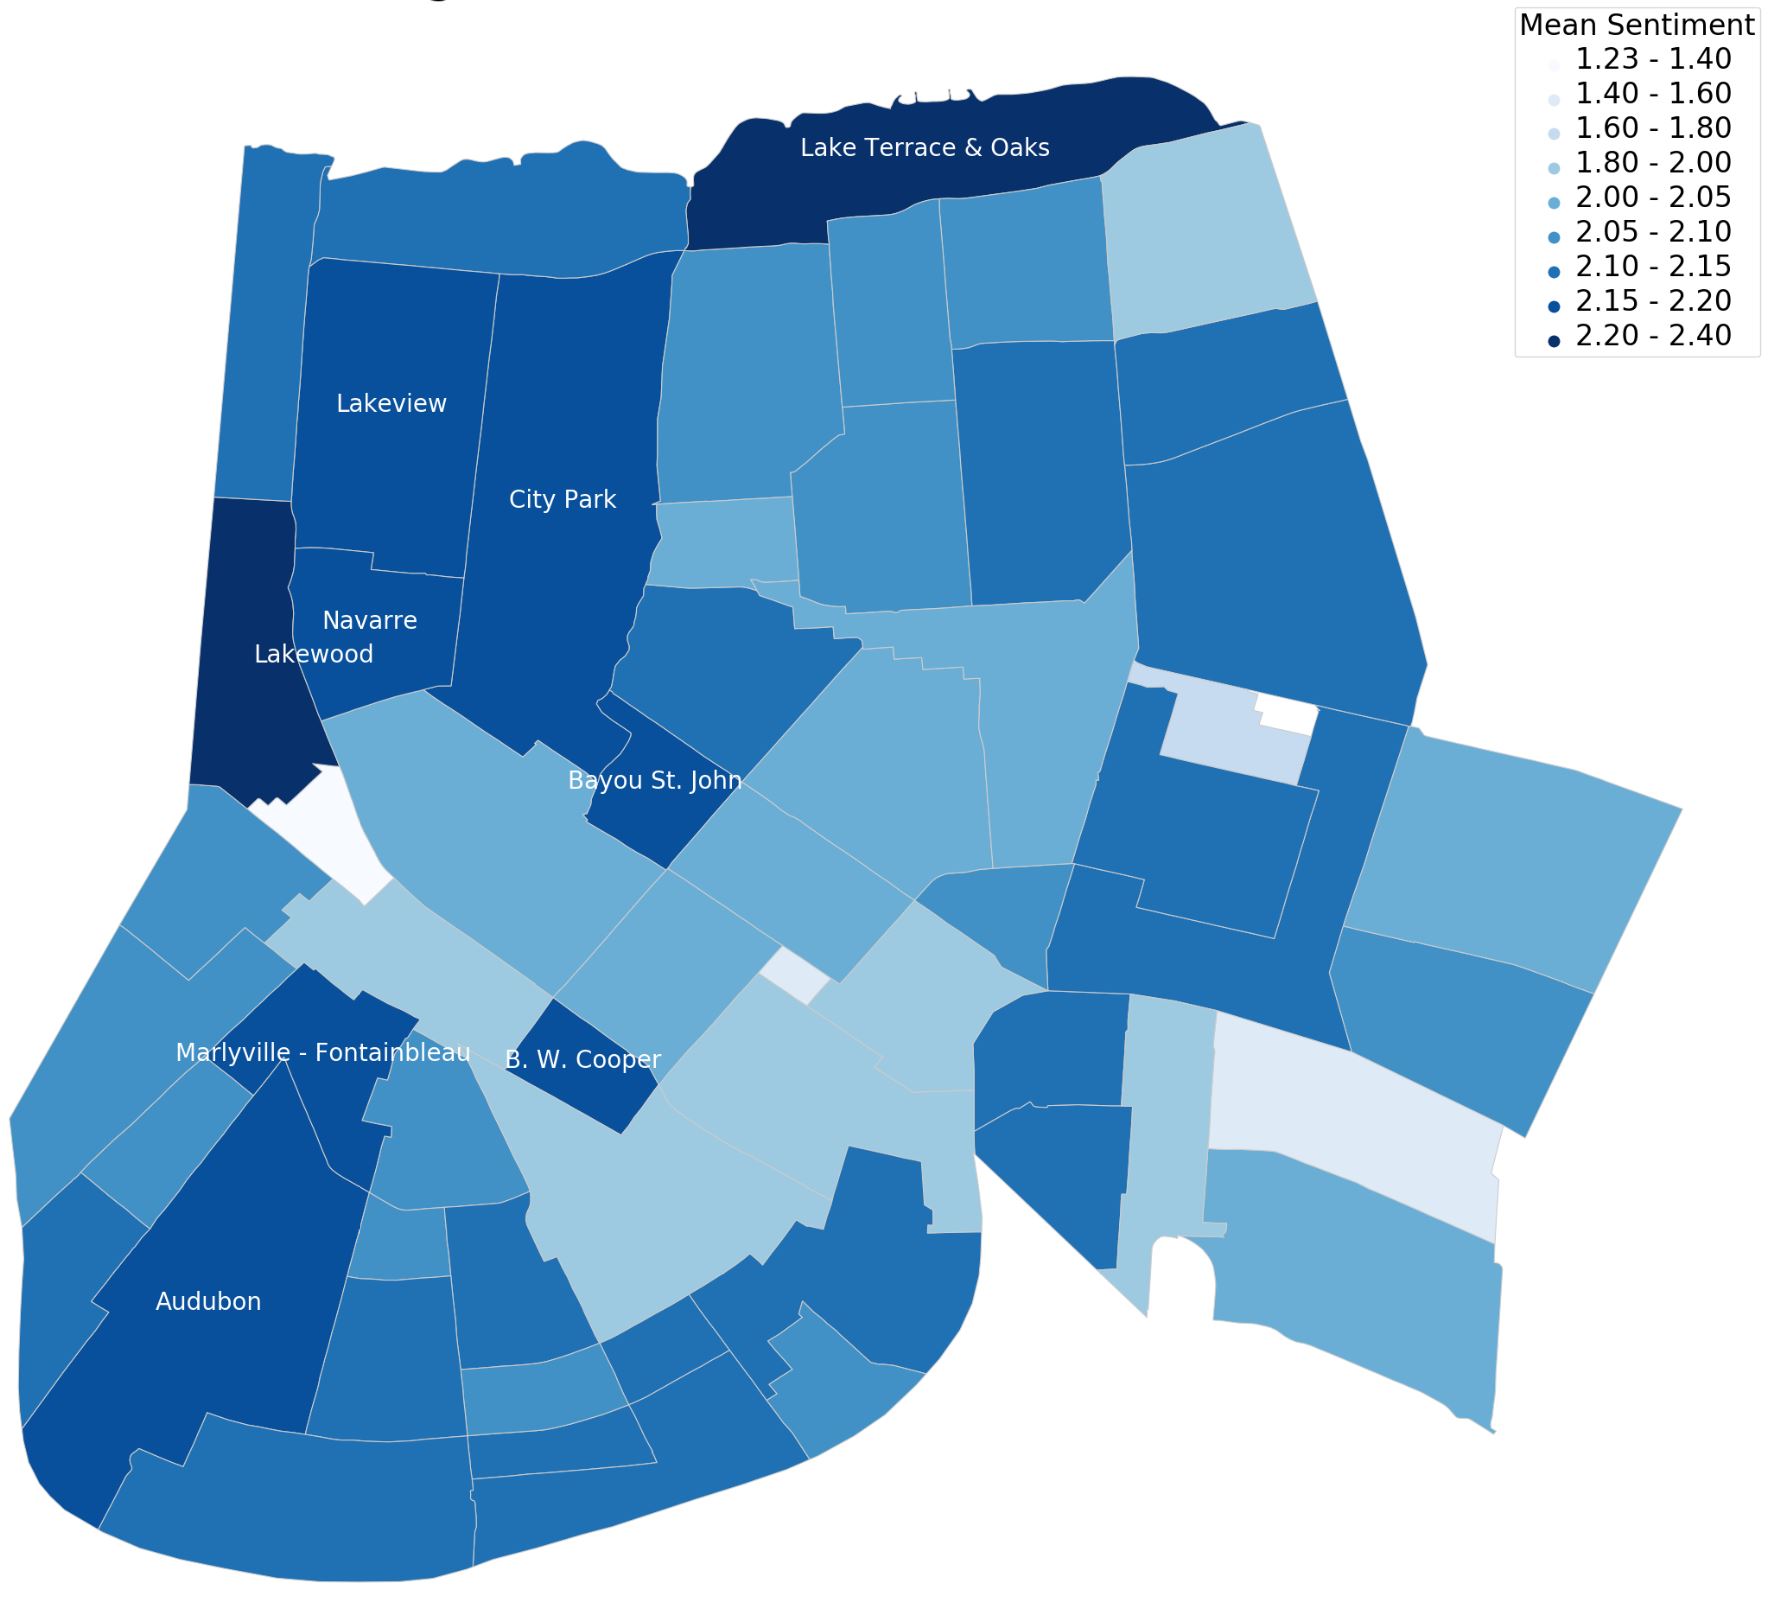
This project provides an analysis and evaluation of the current and prospective Airbnb listings in New Orleans (NO), Louisiana. The report intends to contribute information and advice to potential visitors. Methods of analysis include sentiment analysis, data and feature aggregation as well as visualizations such as boxplots, spatial mappings and calendar plots. Other calculations include occupancy rate, prices and trip length averages. Results show that occupancy rate is higher during key dates in NO. In particular, during NOs large events such as the BUKU Music and Art Project and the New Orleans Jazz and Heritage Festival. This produces an increment in property price and demand. The report finds that the prospects of Airbnb in the NO community is positive because of high (+80) review scores across all neighbourhoods and property types. The majority of properties are of type “house” with a categorized size of small and medium, ideal for families and groups of friends. Properties in summer months are comparatively available resulting in a peaceful and quite vacation.
Forecasting Ingredient Demand for Fast Food Resturants in New York and California
GitHub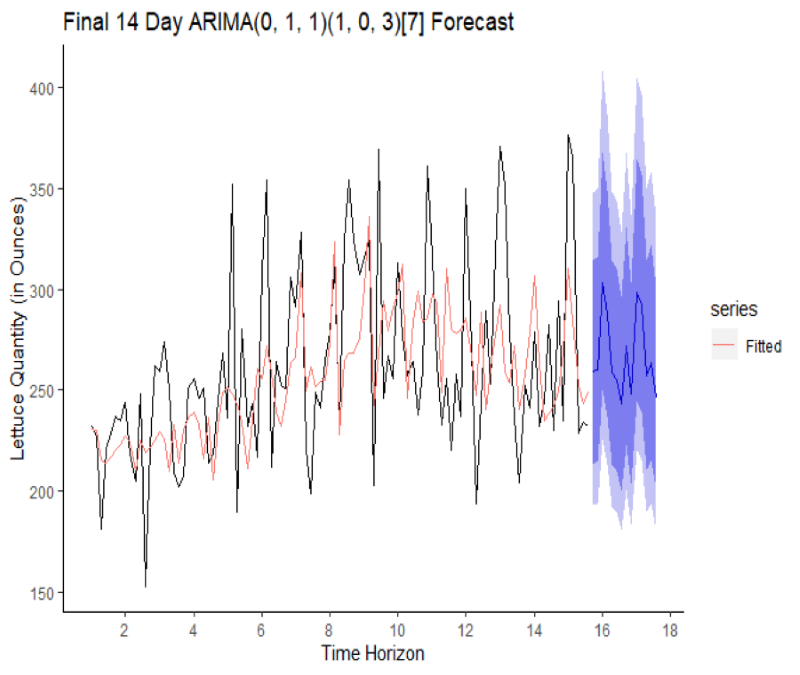
Forecasting methods are utilised in all industries. The ability to make predictions of the future based on past and present data and most commonly by analysis of trends is key to success in any market because if done successfully it may drastically reduce costs and increase company revenue and profit. The food industry in this sense, is no different. With ever-changing tastes, tight profit margins, and fickle consumers, the need for accurate projections is an essential component of business success. Industry leaders use state of the art forecasting techniques, centralized data sources and machine learning algorithms to get a step ahead of the competition and to optimally manage their supply chain. In general however, the problem the industry faces lies with scattered data sources, insufficient consideration of external factors, such as campaigns and promotions, moving holidays, weather and ad hoc solutions. This project forecasts the daily demand for ingredients in a fast-food chain in two different major US markets; New York and California. Each restaurant's historic data is examined and the data is checked for stationarity, transformed and forecasted through an ETS model and a Holt-Winters model. An ARIMA model is also used to forecast ingredient demand in order to test various methods. Finally all three models are evaluated against each other using various estimators of prediction errors and the best is chosen for each individual restaurant location.
Marketing Resource Allocation With Vector Autoregression and Impulse Response Analysis
nbviewer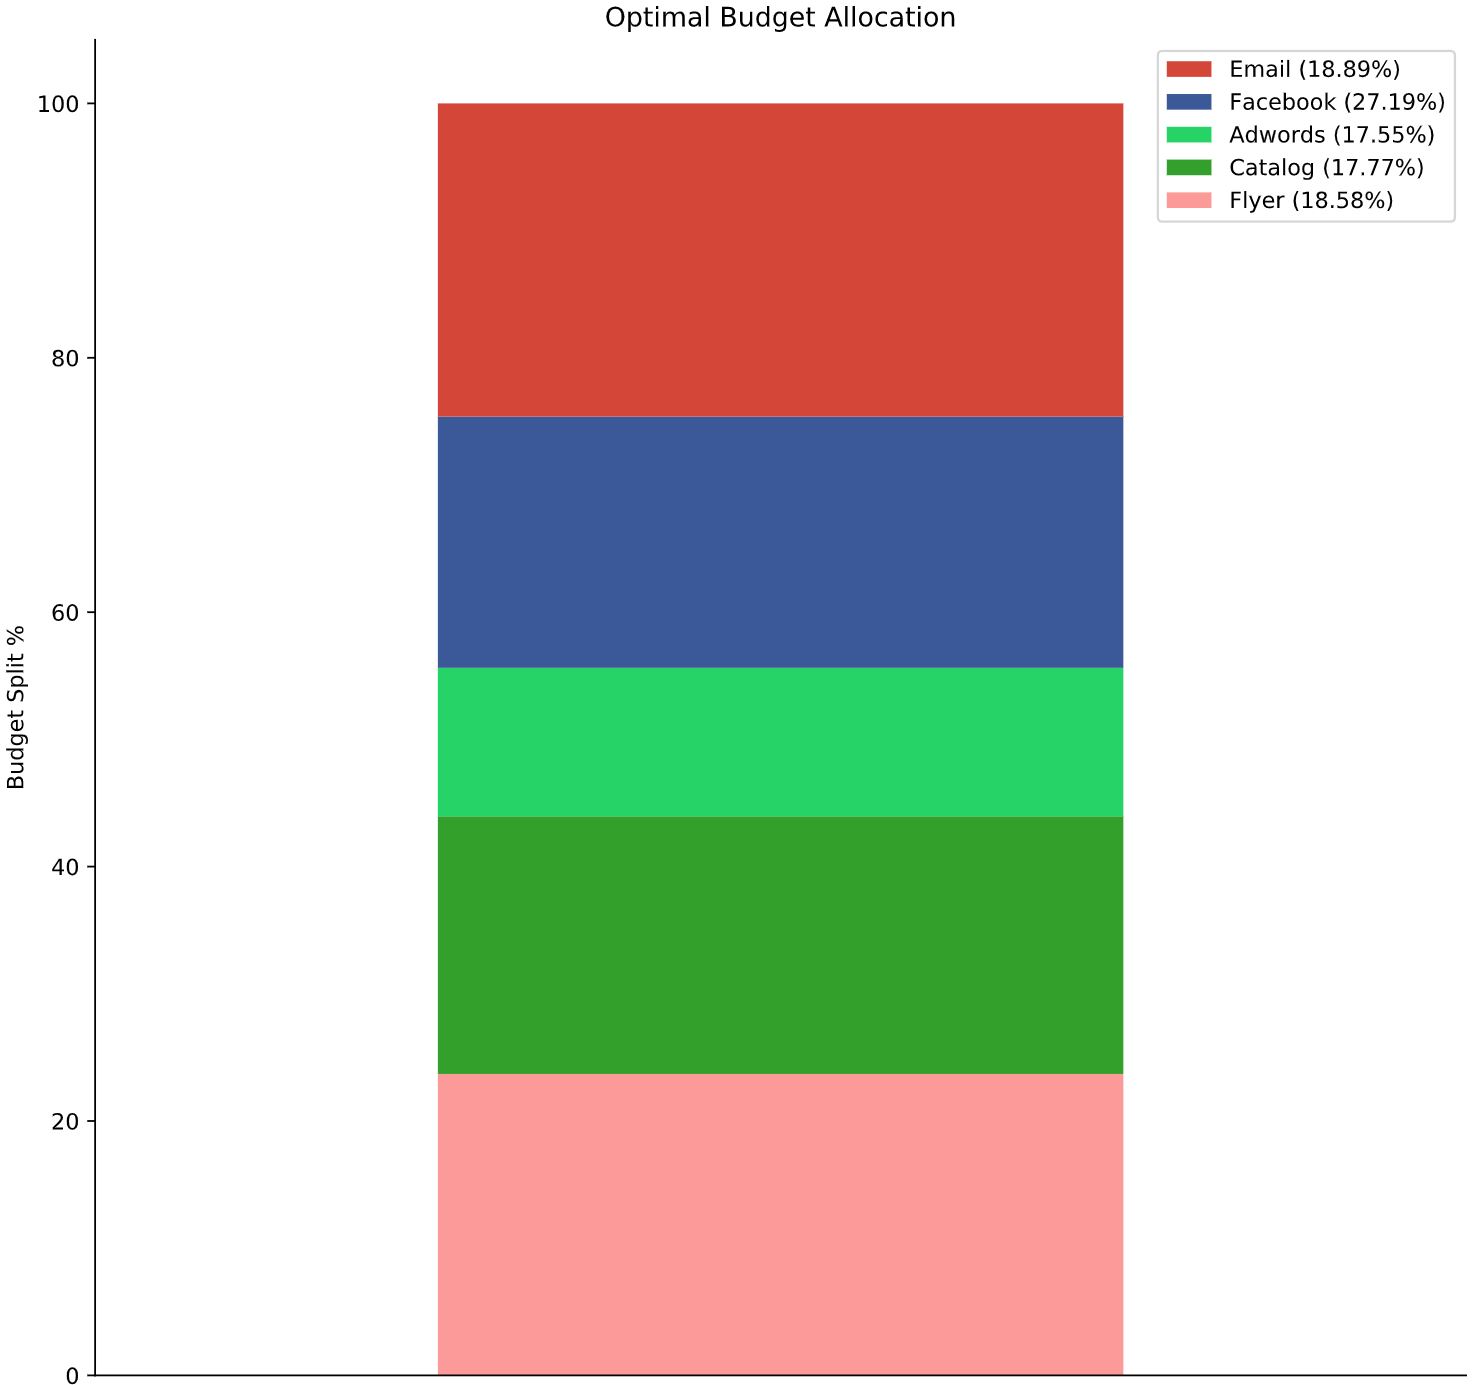
The 2019 global advertisement budget surpassed $560 billion USD, the US and North-American market, unsurpsignly being the largest spenders. These budgets are stretched among various channels as internet advertising now not only relates to “traditional” Google Ads spending or Facebook Ads spending but to influencer marketing on quickly growing social media apps like Tik-Tok and Snapchat. As new marketing opportunities arise decision makers not only need to figure out how much company resource to devote to their marketing campaigns, they need to decide where exactly to spend that budget. The old axiom, “marketers waste half of their money, but they just don’t know which half” still holds true. This project contains a detailed analytical investigation into a retailers marketing budget and it provides an improvement to it by finding its optimal channel allocation. The examination is completed to help the retailer better use their annual marketing budget in order to increase audience reach, conversions and ultimately sales that lead to bottom-line growth. The paper will take a step-by-step approach in solving the optimal resource (channel) allocation problem and will show and explain at each phase what needs to be done to find optimality so that other retailers and companies may adopt the same approach to better allocate their budget.
Back to Top